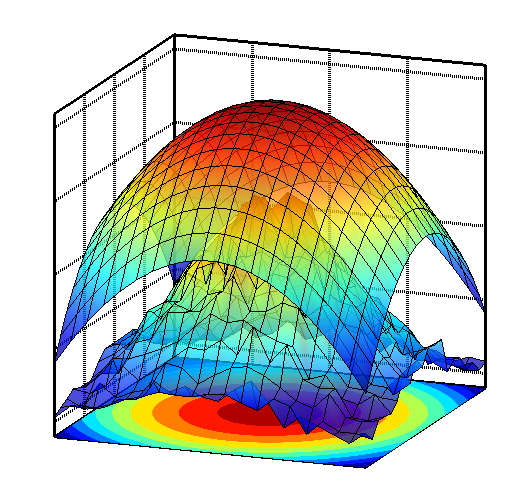
public class HPlot3D
extends jhplot.gui.GHFrame
| Modifier and Type | Field and Description |
|---|---|
boolean |
set |
| Constructor and Description |
|---|
HPlot3D()
Construct a 3D canvas with a plot with the default parameters 600 by 400,
and 10% space for the global title "Default"
|
HPlot3D(String title)
Construct a 3D canvas with a plot with the default parameters 600 by 400,
and 10% space for the global title
|
HPlot3D(String title,
int xs,
int ys)
Construct a 3D canvas with a single plot/graph
|
HPlot3D(String title,
int xsize,
int ysize,
int n1,
int n2)
Create a 3D canvas to display data.
|
HPlot3D(String title,
int xsize,
int ysize,
int n1,
int n2,
boolean set)
Create interactive 3D canvas to display data.
|
| Modifier and Type | Method and Description |
|---|---|
void |
clear()
Clear the current graph including graph settings.
|
void |
clear(int i1,
int i2)
Clear the graph characterized by an index in X and Y.
|
void |
clearAll()
Clear all graphs from data and settings.
|
void |
close()
Close the canvas (and dispose all components) Note: a memory leak is
found - no time to study it.
|
void |
doc()
Show online documentation.
|
void |
draw(F2D f1)
Draw F2D function as a surface.
|
void |
draw(F2D f1,
F2D f2)
Draw two F2D functions on the same plot.
|
void |
draw(F2D h2,
H2D h1)
Draw F2D and H2D on the same plot.
|
void |
draw(H2D f1)
Draw H2D histogram.
|
void |
draw(H2D[] d)
Draw array of histograms
|
void |
draw(H2D h1,
F2D h2)
Draw H2D histogram and F2D function on the same plot.
|
void |
draw(H2D h1,
H2D h2)
Plot two H2D histograms on the same plot.
|
void |
draw(P2D h1)
Display P2D data holder with X,Y,Z values in 3D.
|
void |
draw(P2D[] d)
Draw array of P2D holders
|
void |
draw(P3D h)
Display P3D data holder with X,Y,Z values in 3D as surface.
|
void |
draw(P3D[] d)
Draw array of P3D holders
|
void |
drawBox()
Set drawiing an empty frame.
|
Color |
getAxesFontColor()
Color for tic labels
|
Font |
getAxisFont()
Get font for axes
|
int |
getColorMode()
Get current the color mode
|
double |
getDistance()
Get the distance
|
double |
getElevationAngle()
Get the angle
|
Color |
getFrameColor()
Get color of the frame
|
Color |
getLabelColor()
Get label color
|
double |
getLabelOffset(int axes)
Get offset for labels on X
|
float |
getPenWidthAxes()
Gets the pen width to draw axes.
|
double |
getRotationAngle()
Get the rotation angle
|
double |
getScaling()
Get the scaling
|
jplot3d.SurfaceModelCanvas |
getSurfaceModel()
Get current surface
|
boolean |
isSurface()
Is the plot will be shown as a surface?
|
void |
quit()
exit the frame and clear all components
|
void |
resizePad(double widthScale,
double heightScale)
Resize the current pad.
|
void |
resizePad(int n1,
int n2,
double widthScale,
double heightScale)
Resize the pad given by the inxX and indxY.
|
void |
setAutoRange()
Set autorange in X,Y,Z at the same time for the current plot
|
void |
setAutoRange(boolean b)
Set autorange in X,Y,Z.
|
void |
setAutoRangeAll(boolean b)
Set to autorange all pads
|
void |
setAutoRangeXY()
Set autorange in Y,Z at the same time for the current plot
|
void |
setAxesFontColor(Color fontColorAxes)
Get color for tic labels
|
void |
setAxisFont(Font fontAxis)
Sets font for axes
|
void |
setBars()
Set bar type of plot
|
void |
setBars(boolean a)
Set bar type of plot
|
void |
setBoxColor(Color a)
Set color of the box
|
void |
setBoxed(boolean boxed)
Set boxed frame
|
void |
setColorFill(Color a)
Set color of to fill histogram bars
|
void |
setColorLines(Color a)
Set color of the lines to draw histogram bars
|
void |
setColorMode(int a)
Sets the color mode
|
void |
setContour()
Set contour style
|
void |
setContour(boolean a)
Set contour style
|
void |
setContourLines(int v)
Set number of divisions for contour plots
|
void |
setDensity()
Set density type of plot
|
void |
setDensity(boolean a)
Set density plot
|
void |
setDisplayGrids(boolean a)
Display grid
|
void |
setDisplayXY(boolean a)
Display or not X and Y
|
void |
setDisplayZ(boolean a)
Display or not title for Z
|
void |
setDistance(double distance)
Set distance to the object
|
void |
setDivisions(int v)
Set number of divisions for surface plots
|
void |
setElevationAngle(double angle)
Set the elevation angle
|
void |
setFill(boolean fill)
Set fill color or not for histogram bars
|
void |
setFrameColor(Color a)
Set color of the frame
|
void |
setLabelColor(Color a)
Set color of the label
|
void |
setLabelFont(Font a)
Set Font for the labels
|
void |
setLabelFontColor(Color fontColorLabel)
Set color for labels
|
void |
setLabelOffsetX(double a)
Set label offset on X
|
void |
setLabelOffsetY(double a)
Set label offset on Y
|
void |
setLabelOffsetZ(double a)
Set label offset on Z
|
void |
setNameX(String a)
Set a name for X axis
|
void |
setNameY(String a)
Set a name for Y axis
|
void |
setNameZ(String a)
Set a name for Z axis
|
void |
setPenWidthAxes(double w)
Set line width to draw axes.
|
void |
setRange(double Xmin,
double Xmax,
double Ymin,
double Ymax)
Set X and Y range for the 3D plot.
|
void |
setRange(double Xmin,
double Xmax,
double Ymin,
double Ymax,
double Zmin,
double Zmax)
Set X, Y, Z ranges for the 3D plot
|
void |
setRangeZ(double Zmin,
double Zmax)
Sets the z range of calculated surface vertices.
|
void |
setRotationAngle(double angle)
Set the rotation angle.
|
void |
setScaling(double scale)
Set the scaling
|
void |
setSurface()
Set surface type of plot
|
void |
setSurface(boolean a)
Set surface type of plot
|
void |
setTicFont(Font a)
Set font for the ticks
|
void |
setTicOffset(double a)
Set tick offset
|
void |
update()
Update the graphics
|
void |
update(int n1,
int n2)
Refresh only a particular plot
|
void |
updateAll()
Refresh all the plots on the same canvas HPLOT
|
void |
updateData()
Update data on the plot
|
void |
updateData(int n1,
int n2)
Update data on the plot
|
void |
visible()
Show the canvas
|
void |
visible(boolean vs)
Set the canvas frame visible or not
|
void |
visible(int posX,
int posY)
Set the canvas frame visible.
|
addGraph, cd, componentHidden, componentMoved, componentShown, getCdX, getCdY, getFrame, getHTMLUrl, getNtotX, getNtotY, setPlotsNum, updateFrameaddComp, componentResized, convertSVG, convertSVG, disableDoubleBuffering, enableDoubleBuffering, export, getCanvasPanel, getMarginBackground, getMarginPanelBottom, getMarginPanelCenter, getMarginPanelLeft, getMarginPanelRight, getMarginPanelTop, getMarginSizeBottom, getMarginSizeLeft, getMarginSizeRight, getMarginSizeTop, getSizeX, getSizeY, getTextBottom, getTextBottomColor, getTextBottomColorBack, getTextBottomFont, getTextLeft, getTextLeftColor, getTextLeftColorBack, getTextLeftFont, getTextPosBottomX, getTextPosBottomY, getTextPosLeftX, getTextPosLeftY, getTextPosRightX, getTextPosRightY, getTextPosTopX, getTextPosTopY, getTextRight, getTextRightColor, getTextRightColorBack, getTextRightFont, getTextRotationBottom, getTextRotationLeft, getTextRotationRight, getTextRotationTop, getTextTop, getTextTopColor, getTextTopColorBack, getTextTopFont, isBorderShown, printGraph, resetMargins, setGTitle, setGTitle, setGTitle, setGTitle, setGTitle, setMarginBackground, setMarginSizeBottom, setMarginSizeLeft, setMarginSizeRight, setMarginSizeTop, setSizePanel, setTextBottom, setTextBottom, setTextBottom, setTextBottom, setTextBottomColorBack, setTextLeft, setTextLeft, setTextLeft, setTextLeft, setTextLeftColorBack, setTextPosBottomX, setTextPosBottomY, setTextPosLeftX, setTextPosLeftY, setTextPosRightX, setTextPosRightY, setTextPosTopX, setTextPosTopY, setTextRight, setTextRight, setTextRight, setTextRight, setTextRightColorBack, setTextRotationBottom, setTextRotationLeft, setTextRotationRight, setTextRotationTop, setTextTop, setTextTop, setTextTop, setTextTopColorBack, showBorderspublic HPlot3D(String title, int xsize, int ysize, int n1, int n2, boolean set)
title - Titlexsize - size in x directionysize - size in y directionn1 - number of plots/graphs in xn2 - number of plots in ypublic HPlot3D(String title, int xsize, int ysize, int n1, int n2)
title - Titlexsize - size in x directionysize - size in y directionn1 - number of plots/graphs in xn2 - number of plots/graphs in yset - set or not the graphpublic HPlot3D(String title, int xs, int ys)
title - Title for the canvasxs - size in xys - size in ypublic HPlot3D(String title)
title - Titlepublic HPlot3D()
public void resizePad(double widthScale,
double heightScale)
widthScale - scale factor applied to the width of the current padheightScale - scale factor applied the height of the current pad.public void resizePad(int n1,
int n2,
double widthScale,
double heightScale)
n1 - the location of the plot in xn2 - the location of the plot in ywidthScale - scale factor applied to the width of the current padheightScale - scale factor applied the height of the current pad.public void setDistance(double distance)
distance - distancepublic double getDistance()
public void setScaling(double scale)
scale - public double getScaling()
public void setRotationAngle(double angle)
angle - anglepublic double getRotationAngle()
public void setElevationAngle(double angle)
angle - elevation anglepublic double getElevationAngle()
public void setLabelFontColor(Color fontColorLabel)
fontColorLabel - public void update(int n1,
int n2)
n1 - the location of the plot in xn2 - the location of the plot in ypublic void updateData(int n1,
int n2)
n1 - the location of the plot in xn2 - the location of the plot in ypublic void updateData()
public double getLabelOffset(int axes)
public void updateAll()
public void clear()
public void clear(int i1,
int i2)
i1 - location of the graph in Xi2 - location of the graph in Ypublic void setPenWidthAxes(double w)
w - width of the linespublic float getPenWidthAxes()
public void drawBox()
public void clearAll()
public void quit()
public void visible(boolean vs)
vs - (boolean) true: visible, false: not visiblepublic void visible(int posX,
int posY)
posX - - the x-coordinate of the new location's top-left corner in
the parent's coordinate space;posY - - he y-coordinate of the new location's top-left corner in the
parent's coordinate spacepublic void visible()
public boolean isSurface()
public void setNameX(String a)
a - Name of the label for X axispublic void setNameY(String a)
a - Name of the label for Y axispublic void setNameZ(String a)
a - Name of the label for Z axispublic void setLabelFont(Font a)
a - Fontpublic void setAxisFont(Font fontAxis)
fontAxis - fontpublic Font getAxisFont()
public void setLabelColor(Color a)
a - Colorpublic void setColorLines(Color a)
a - Colorpublic void setColorFill(Color a)
a - Colorpublic void setFill(boolean fill)
fill - if true, color will be set for the histogram barspublic void setTicFont(Font a)
a - Fontpublic void setDisplayXY(boolean a)
a - true if it should be shownpublic void setDivisions(int v)
v - number of divisions in X and Ypublic void setContourLines(int v)
v - number of divisions in X and Ypublic void setDisplayGrids(boolean a)
a - true if grid is displayedpublic void setDisplayZ(boolean a)
a - true, if it is shownpublic void setContour()
public void setContour(boolean a)
a - public void setDensity()
public void setDensity(boolean a)
a - public void setSurface()
public void setSurface(boolean a)
public void setBars()
public void setBars(boolean a)
public void setBoxColor(Color a)
a - Colorpublic void setFrameColor(Color a)
a - Colorpublic void setBoxed(boolean boxed)
boxed - true if it is boxedpublic Color getAxesFontColor()
public void setAxesFontColor(Color fontColorAxes)
fontColorAxes - colorpublic Color getFrameColor()
public void setColorMode(int a)
a - color modes:
0: WIREFRAME
1: HIDDEN
2: SPECTRUM IN COLOR
3: GRAYSCALE
4: DUALSHADES
5: FOG
6: MESH
public jplot3d.SurfaceModelCanvas getSurfaceModel()
public int getColorMode()
a - color modes:
0: WIREFRAME
1: HIDDEN
2: SPECTRUM IN COLOR
3: GRAYSCALE
4: DUALSHADES
5: FOG
6: MESH
public Color getLabelColor()
public void update()
public void setTicOffset(double a)
a - tick offsetpublic void setLabelOffsetX(double a)
a - label offsetpublic void setLabelOffsetY(double a)
a - label offsetpublic void setLabelOffsetZ(double a)
a - label offsetpublic void setRange(double Xmin,
double Xmax,
double Ymin,
double Ymax)
Xmin - Min in XXmax - Max in XYmin - Min in YYmax - Max in Ypublic void setRange(double Xmin,
double Xmax,
double Ymin,
double Ymax,
double Zmin,
double Zmax)
Xmin - Min in XXmax - Max in XYmin - Min in YYmax - Max in YZmin - Min in ZZmax - Max in Zpublic void setRangeZ(double Zmin,
double Zmax)
Zmin - the minimum zZmax - the maximum zpublic void draw(H2D f1)
f1 - H2D histogrampublic void draw(H2D[] d)
d - array of histogramspublic void draw(P2D h1)
h1 - P2D data holderpublic void draw(P2D[] d)
d - array of P2D data holderspublic void setAutoRange(boolean b)
b - if true, sets autorangepublic void setAutoRangeAll(boolean b)
b - public void setAutoRange()
public void setAutoRangeXY()
public void draw(P3D h)
h - P3D data holder.public void draw(P3D[] d)
d - array of P3D data holderspublic void draw(H2D h1, H2D h2)
h1 - first H2D histogramh2 - second H2D histogrampublic void draw(F2D f1)
f1 - F2D functionpublic void draw(F2D f1, F2D f2)
f1 - first F2D functionf2 - second F2D functionpublic void draw(H2D h1, F2D h2)
h1 - H2D histogramh2 - F2D functionpublic void draw(F2D h2, H2D h1)
h2 - F2D functionh1 - H2D histogrampublic void close()
public void doc()
DMelt 2.0 © DataMelt by jWork.ORG